Analyse et signaux de trading précis

Devenez trader avec nos formations et coaching personnalisés.

Votre partenaire en trading

Chez Scalpel Chirurgical, nous offrons des analyses précises et des signaux de trading, ainsi que des formations pour devenir trader expert.

A digital financial chart with green and red zigzag lines on a dark background, representing market trends. Below the main graph, there are smaller charts featuring bar indicators in red and blue, along with a yellow line graph.
A tablet displaying a detailed digital financial trading interface with various graphs, charts, and numerical data. The screen shows candlestick charts with green and red indicators, illustrating market trends and stock prices.
A computer monitor displays a cryptocurrency exchange interface with various graphs, charts, and numerical data. On the left side, there are options for buying and selling, as well as a list of recent trades. The main graph on the right shows a price chart with a candlestick pattern, indicating fluctuations in the market over a period of time.

Qui sommes-nous ?

Nous sommes spécialisés dans l'analyse des marchés boursiers, fournissant des signaux de trading sur Telegram et des formations pour futurs traders.

Services de Trading

Analyse précise et signaux de trading sur Telegram pour optimiser vos investissements boursiers.

Coaching pour Traders
A hand holds a smartphone displaying a financial chart with candlestick patterns. In the background, a large, similar financial graph is visible on a screen, featuring fluctuating lines and data points.

Formations et accompagnement pour devenir un trader compétent et efficace sur les marchés.

A laptop displays a financial trading platform with a candlestick chart showing stock market data. The chart is colorful, with blue and orange bars representing volume, and fluctuating lines indicating stock prices over time. Surrounding the laptop are two small potted plants on a white surface.
A smartphone displaying a financial chart with candlestick patterns is placed on a dark, crumpled fabric surface. The chart features various colored candlesticks against a dark background, suggesting financial analysis or stock market activity.
Analyse de Marché

Évaluations détaillées des tendances du marché pour des décisions d'investissement éclairées et rentables.

Signaux de Trading Fiables

Alertes précises pour maximiser vos gains sur les marchés boursiers.

Les signaux de trading de Scalpel Chirurgical sont précis et m'ont aidé à réussir sur les marchés.

Jean Dupont

A person is holding a smartphone displaying a financial trading app. The screen shows a candlestick chart with various trading metrics, including the current price, percentage changes, and buttons for different actions. The person's hands are visible, and a black background accentuates the smartphone screen.
A person holds a smartphone displaying a stock market trading app with candlestick charts. A laptop is on a wooden table with a similar financial chart, indicating active trading or analysis. The setting suggests a home office or casual workspace.

★★★★★

Précision

Analyse et signaux de trading pour devenir trader expert.

A hand holding a smartphone displaying a colorful line graph with various candlestick patterns, indicative of financial or stock market data. The background consists of a textured, woven fabric surface in neutral tones.
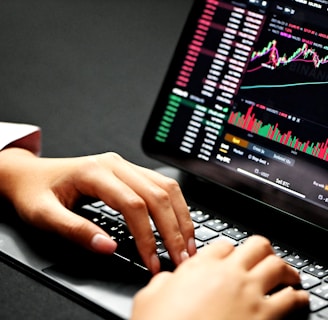
Hands typing on a laptop keyboard with a screen displaying financial graphs and stock market data. Multiple charts and numbers are visible, indicating online trading or financial analysis.
A person is using a smartphone to view a financial market chart. The screen displays a candlestick chart with green and red bars, likely indicating cryptocurrency or stock prices. The person appears to be seated, wearing casual clothes like shorts and holding the phone in both hands.
A hand holding a smartphone displaying a cryptocurrency trading application. The screen shows a candlestick chart for BTC/BUSD with a price of 36,437.00, as well as other information like the order book, market history, and margin data. The background has a two-tone color scheme with blue on the left and light gray on the right. The person is wearing a pinkish-red long-sleeve shirt.
A hand is holding a smartphone that displays a stock market chart with various candlestick patterns and horizontal lines. The phone is held against a textured fabric background, which appears to be a sofa or carpet.